Directions (next five questions) : Study the table carefully to answer the questions given below:
Number of Items Manufactured (M) and sold (S) (in millions)
by Six Different Companies
over the Years
|
Year |
Company |
|||||||||||
|
A |
B |
C |
D |
E |
F |
|||||||
|
M |
S |
M |
S |
M |
S |
M |
S |
M |
S |
M |
S |
|
|
2003 |
8.5 |
5.3 |
7.3 |
6.6 |
8.0 |
6.0 |
7.6 |
5.2 |
7.5 |
6.1 |
7.8 |
4.5 |
|
2004 |
8.3 |
6.2 |
7.9 |
6.2 |
8.1 |
5.8 |
8.3 |
5.7 |
8.0 |
6.6 |
7.8 |
5.0 |
|
2005 |
6.5 |
3.1 |
6.9 |
4.8 |
7.8 |
4.3 |
7.8 |
4.5 |
8.5 |
6.8 |
8.4 |
5.4 |
|
2006 |
7.2 |
5.2 |
8.3 |
5.3 |
7.9 |
4.6 |
7.9 |
4.8 |
6.7 |
5.4 |
8.2 |
6.2 |
|
2007 |
7.1 |
5.8 |
8.0 |
5.9 |
7.9 |
4.9 |
6.8 |
5.0 |
7.7 |
4.9 |
8.7 |
6.0 |
|
2008 |
8.0 |
6.2 |
8.2 |
6.1 |
7.6 |
6.0 |
7.5 |
6.1 |
7.9 |
4.9 |
6.5 |
4.2 |
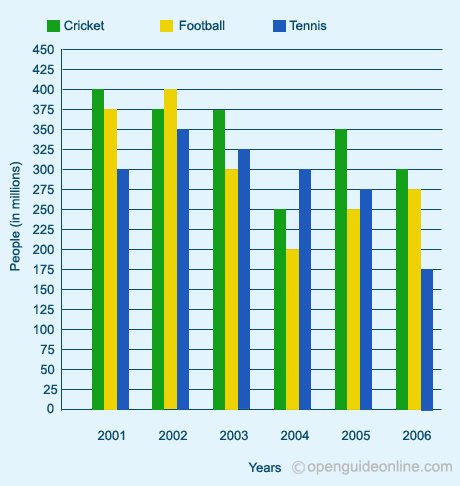
Directions (next five questions) : Study the following graph carefully and answer the questions given below.
Preference of people in Playing Different
Games over the Years