The plot given above represents the velocity of a particle (in m/s) with time (in seconds). Assuming that the plot represents a semi-circle distance traversed by the particle at the end of 7 seconds is approximately
Area under a velocity-time graph indicates the displacement
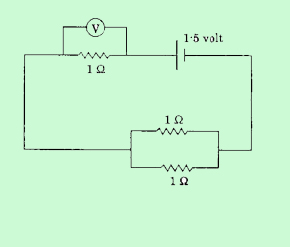
What should be the reading of the voltmeter in the circuit given above? (All the resistances are are equal to 1 Ω and the battery is of 1.5 volt)
A bullet of mass 20 gm is fired in the horizontal direction with a velocity 150 m from a pistol of mass 1 kg. Recoil velocity of the pistol is
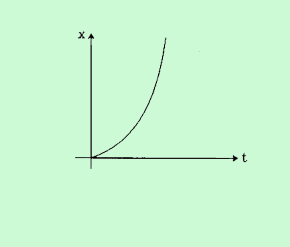
The plot given above represents displacement ‘x’ of a particle with time ‘t’. The particle is
Motion, of a particle can be described in x-direction by x = a sin ωt, and y-direction by y = b cos ωt. The particle is moving on
During sunrise and sunset, sun appears reddish-orange because