The pie-chart shows the percentage of literate and illiterate male and female in a state. Study the diagram and answer the following questions.
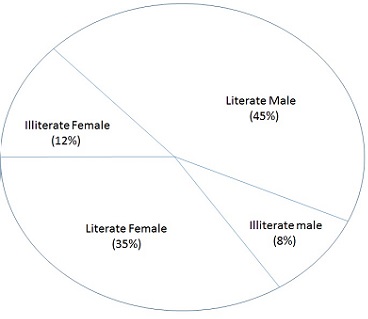


    The difference of central angles corresponding to illiterate male and illiterate female is

  • 12.2°
  • 13.4°
  • 11.2°
  • 14.4°
The pie-chart shows the percentage of literate and illiterate male and female in a state. Study the
Home Ask Questions Study Current Affairs Previous Papers Kerala PSCIBPSUPSCRBITNPSCMPSCSSCCBSEUnited StatesModel Tests News More Answers Coaching Centres Careers Downloads Colleges