Study the following Bar graph and answer the question . The Bar Graph gives the annual rates of inflation in percentages for 1975 and 1987.
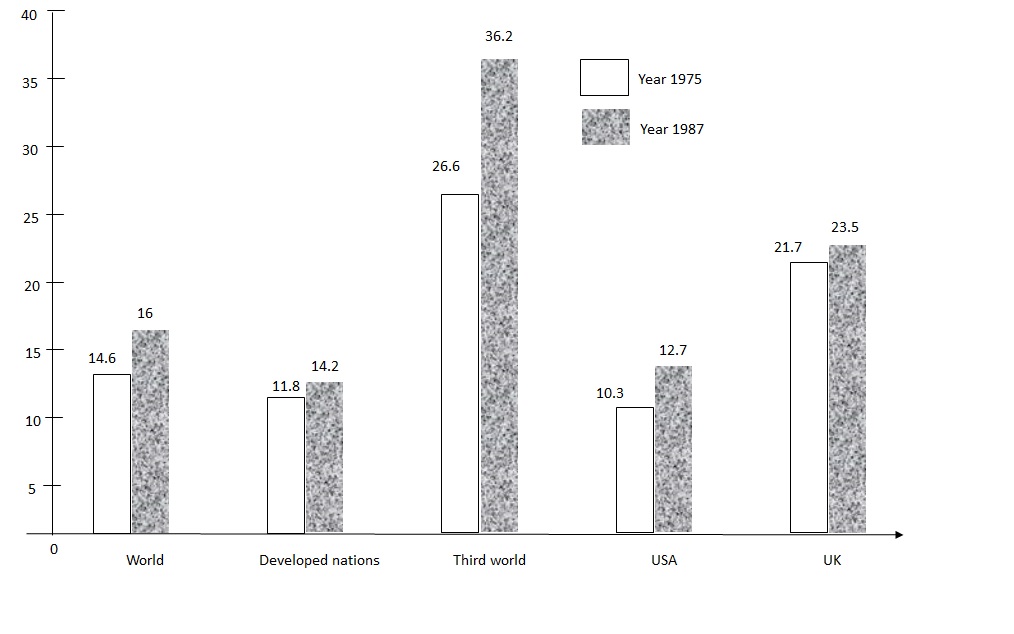

    The change in rate of inflation was least in which of the following .

  • Developed Nations
  • UK
  • World
  • Third world
Study the following Bar graph and answer the question . The Bar Graph gives the annual rates of infl
Home Ask Questions Study Current Affairs Previous Papers Kerala PSCIBPSUPSCRBITNPSCMPSCSSCCBSEUnited StatesModel Tests News More Answers Coaching Centres Careers Downloads Colleges