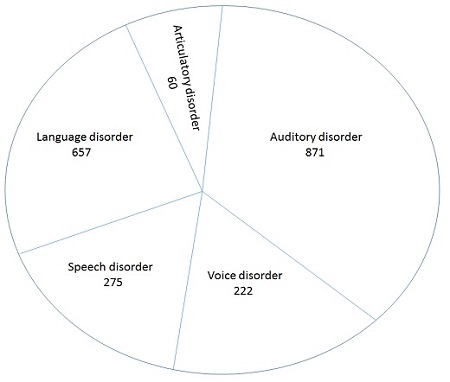
The pie-chart shows Distribution of Special Children Population during the year 1994-96. Study the pie-chart and answer the following questions.
The pie-chart shows Distribution of Special Children Population during the year 1994-96. Study the pie-chart and answer the following questions.