Directions (next five questions) : Refer to the graph and answer the given questions.
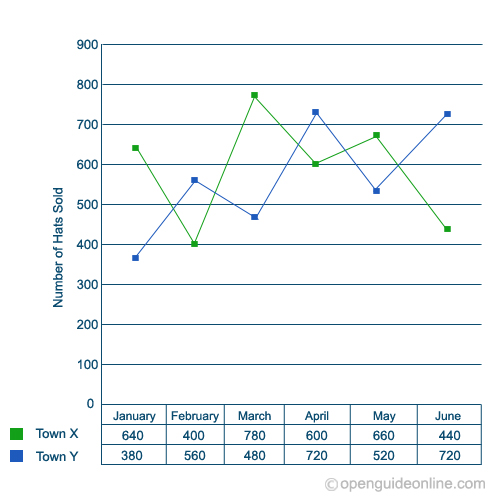
Data related to number of hats sold by
two stores (M and N) during six given months
Stores M and N sell only two types of hats : Fedora Hats and Trillby Hats. If the respective ratio of total number of Fedora hats to total number of Trilby hats sold by stores M and N together during March
In march, total number of hats sold by stores M and N together = 780+480 = 1260
∴ Total number of Fedora hats sold by both the stores
=9/14×1260 = 810
What is the average number of hats sold by store N during January, March May and June
Number of hats sold by store M during January is what percent of the total number of hats sold by the store N during March and April together
16000/- was invested for three years, partly in Scheme A at the rate of 5% simple interest per annum and partly in Scheme B at the rate of 8% simple interest per annum. Total interest received at the end was INR 3480/-. How much sum of money was invested in Scheme A
10 men can finish a piece of work in 15 days. 8 women can finish the same piece of work in 25 days. Only 10 women started working and in few days completed certain amount of work. After that 3 men joined them. The remaining work was completed by 10 women and 3 kmen together in 5 days. After how many days 3 men joined 10 women
A sells an item at 20% profit to B. B sells it to C at 10% profit. C sells it to D at INR 116/- profit. Difference between the cost price of D and cost price of A was INR 500/-. How much did B pay to A for the item