Directions (145-150) : Study the following Pie charts and answer the questions given below them.
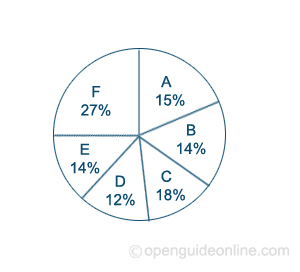
Percentage of Six different types of garments in store I
I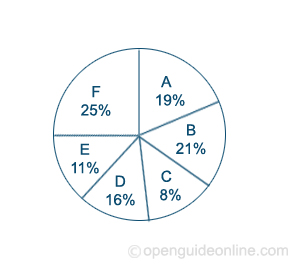
Total number of garments in store I = 12600
Percentage of six different types of garments in store II
Total number of garments in store II = 14500
Number of D type of garments in store I is more than that in store II by what percent approximately?
Directions (Next six quesions) : Study the following information carefully to answer the questions.
Details of population as recorded in a census
Population of state ‘P’ is 150% of population of state ‘T’ and 80% of the population of state ‘U’. Population of State ‘Q’ is 60% of the population of state ‘V’. population of state ‘S’ is 125% of population o state ‘R’. Population of state ‘U’ is 75 lakhs which is 80% of the population of state ‘V’ and 120%of the population of state ‘S’.