Directions (Question: Following six questions) : In the following bar diagram the number of engineers employed in various companies has been given. Study the bar diagram carefully to answer the questions.
The number of post graduate engineers employed in the company W is what per cent of the total engineers employed in that company ?
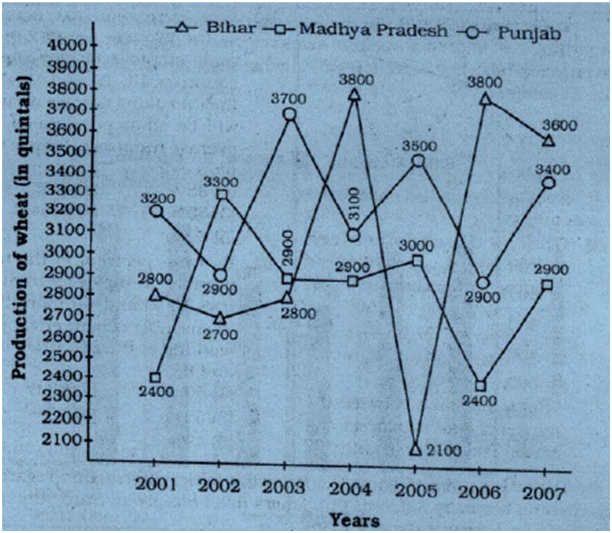
Directions (Question: Following six questions) : In the following multiple graphs production of wheat (in quintals) by three states - Bihar, Madhya Pradesh and Punjab-have been given. Study the following graphs carefully to answer the questions.
What was the total production of wheat by these three states in the year 2007 ? (In quintals)
By what percent is the total production of wheat by three states in the years 2002,2003 and 2004 more or less than that In the years 2005. 2006 and 2007 ?
If the productions of wheat in Bihar in the years 2001,2002, 2003 and 2004 increase by 20%. 25%, 28% and 35% respectively: what will be the percentage increase in the average production of the state for the given years ?
In the given years, what is the average production of wheat in Bihar? (in quintals)
If the production of wheat by Madhya Pradesh in the years 2003, 2004, 2005 and 2007 increase by 30%. 40%, 45% and 40% respectively, what will be the overall percentage increase in the production of wheat in the state in the given years?