Directions / next two questions : The following bar diagram graph depicts the sales of items (in lakhs) in a departmental store from April to August in the current year. Study the graph and answer the following questions using the data provided here.
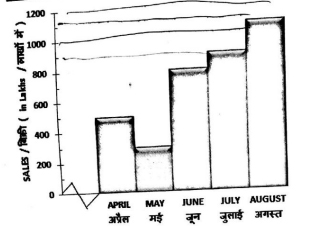
(Applicable only to the following question)