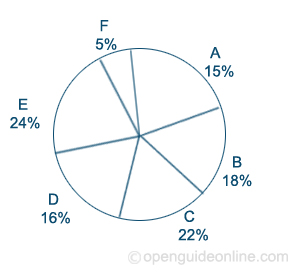
Directions (next five questions) : Refer to the pie chart and answer the given questions.
Percentage of Associate Professors in different Universities in the year January 2013 Total number =300
Directions (next five questions) : Each of the questions given below consist of a question and two statements numbered I and II given below it. You have decide whether the data provided in the statements is sufficient to answer the question. Read both the statements and
Give answer :
(1) If the data in statement I alone is sufficient to answer the question, while the data in statement II alone is not sufficient to answer the question.
(2) If the data statement II alone is sufficient to answer the question, while the data in both the statements I alone is not sufficient to answer the question.
(3) If the data in statement I alone or in statement II alone is sufficient to answer the question.
(4) If the data in both the statement I and II is not sufficient to answer the question.
(5) If the data in both the statement I and II together is necessary to answer the question.