Directions (Next Five Questions) : Refer to the graph carefully to answer the given questions.
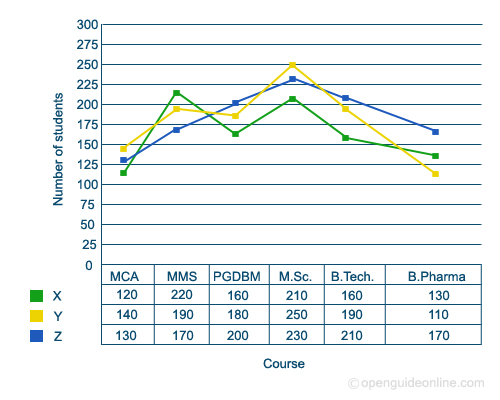
Number of students studying different courses from three different institutes
Directions (Next Five Questions) : Refer to the table to answer the given questions :
Number of items manufactured (in thousands) by six units of a company and percentage of defective items over the years
|
Unit/year |
H |
J |
K |
L |
M |
P |
||||||
|
|
N |
%D |
N |
%D |
N |
%D |
N |
%D |
N |
%D |
N |
%D |
|
2007 |
12 |
1.5 |
15 |
0.8 |
10 |
0.75 |
16 |
1.2 |
18 |
2.2 |
17 |
1.6 |
|
2008 |
16 |
1.2 |
21 |
1.8 |
14 |
1.1 |
20 |
2.3 |
17 |
1.4 |
22 |
2.2 |
|
2009 |
14 |
0.6 |
19 |
1.3 |
16 |
0.45 |
18 |
0.8 |
21 |
1.1 |
20 |
1.4 |
|
2010 |
15 |
0.4 |
20 |
1.5 |
19 |
1.1 |
21 |
1.1 |
22 |
0.8 |
23 |
1.8 |
N : Number of items manufactured
%D : Percentage of defective items