Directions (next five questions) : Refer to the table and answer the given questions.
Data related to number of candidates appeared
and qualified in a competitive exam from
2 states during 5 years
|
Year
|
State P
|
State Q
|
|
Number of
Appeared
candidates
|
Percentage of
Appeared
Candidates who
qualified
|
Number of
Appeared
candidates
|
Percentage of
Appeared
Candidates who
qualified
|
|
2006
|
450
|
60%
|
-
|
30%
|
|
2007
|
600
|
43%
|
-
|
45%
|
|
2008
|
-
|
60%
|
280
|
60%
|
|
2009
|
480
|
70%
|
550
|
50%
|
|
2010
|
380
|
-
|
400
|
-
|
Note: Few values are missing in the table (indicated by - )A candidate is expected to calculate the missing value, if it is required to answer the given questions on the basis of given data and information
Directions (next three questions) : Study the following information to answer the given questions.
A bucket contains 8 red, 3 blue and 5 green marbles.
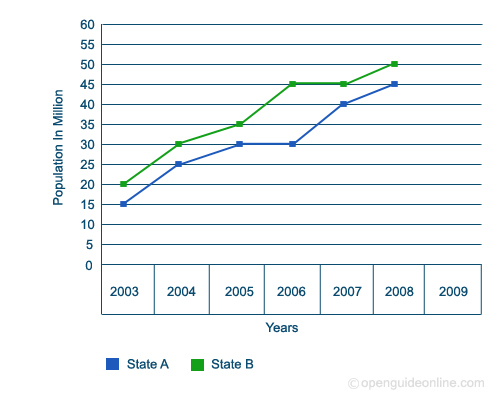
Directions (next five questions) : Refer the following graph to given answer.
Populations of two States (In Million) Over The Years