Directions (next five questions) : Refer to the graph and answer the given questions.
Data related to number of hats sold by
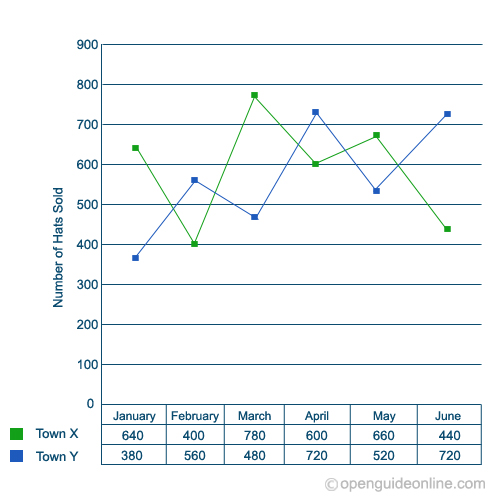
two stores (M and N) during six given months
Number of hats sold by store M increased by what percent from February to May
Required increased percentage
=(660-400/400×100)% = 65%
If the total number of hats sold by stores M and N together in July is 15% more than the total number of hats sold by the same stores together during June, what is the total number of hats sold by the same stores together during July
Stores M and N sell only two types of hats : Fedora Hats and Trillby Hats. If the respective ratio of total number of Fedora hats to total number of Trilby hats sold by stores M and N together during March
What is the average number of hats sold by store N during January, March May and June
Number of hats sold by store M during January is what percent of the total number of hats sold by the store N during March and April together
16000/- was invested for three years, partly in Scheme A at the rate of 5% simple interest per annum and partly in Scheme B at the rate of 8% simple interest per annum. Total interest received at the end was INR 3480/-. How much sum of money was invested in Scheme A