Directions (145-150) : Study the following Pie charts and answer the questions given below them.
Percentage of Six different types of garments in store I
I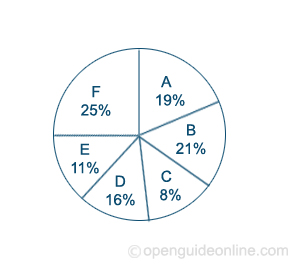
Total number of garments in store I = 12600
Percentage of six different types of garments in store II
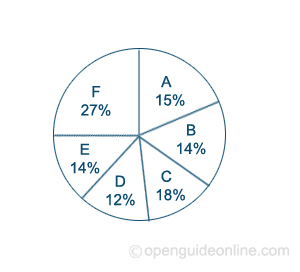
Total number of garments in store II = 14500
Directions (Next six quesions) : Study the following information carefully to answer the questions.
Details of population as recorded in a census
Population of state ‘P’ is 150% of population of state ‘T’ and 80% of the population of state ‘U’. Population of State ‘Q’ is 60% of the population of state ‘V’. population of state ‘S’ is 125% of population o state ‘R’. Population of state ‘U’ is 75 lakhs which is 80% of the population of state ‘V’ and 120%of the population of state ‘S’.
Directions (Next Six Questions) : in these questions, a number of series is given. After the series a number is given followed by (1), (2), (3), (4) and (5). You have to complete the series starting with the given numbers following the sequence of original series and answer the question that follows the series.
Directions (Next six quesions) : Study the following information carefully to answer the questions.
Details of population as recorded in a census
Population of state ‘P’ is 150% of population of state ‘T’ and 80% of the population of state ‘U’. Population of State ‘Q’ is 60% of the population of state ‘V’. population of state ‘S’ is 125% of population o state ‘R’. Population of state ‘U’ is 75 lakhs which is 80% of the population of state ‘V’ and 120%of the population of state ‘S’.
Directions (Next three questions) : Study the information to answer the questions.
A bag contains 6 red shirts, 6 green shirts and 8 blue shirts.
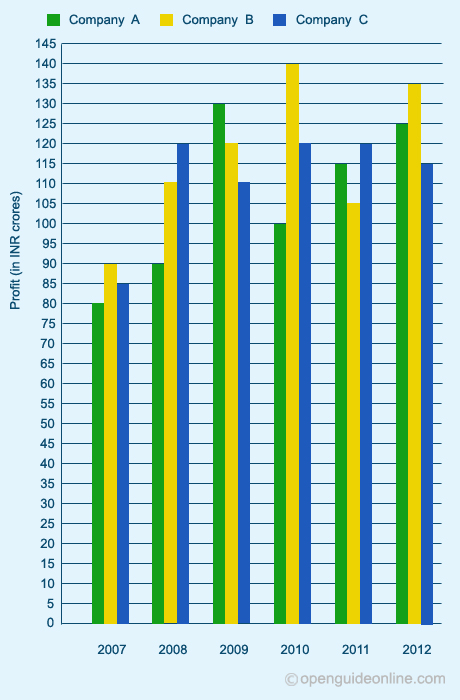
Directions (Next Six Questions) : Study the following graph and answer the given questions.
Profit earned by three companies over the years (in INR Crores)
Directions (Next Six Questions) : Study the following table to answer these questions:
Production of different food grains (in thousand tones) by six states in 2007
|
State
|
Wheat
|
Rice
|
Jowar
|
Bajra
|
|
Rajasthan
|
240
|
160
|
120
|
80
|
|
Chhattisgarh
|
360
|
250
|
210
|
180
|
|
Uttar Pradesh
|
280
|
220
|
150
|
130
|
|
Kerala
|
120
|
230
|
100
|
270
|
|
West Bengal
|
100
|
280
|
200
|
140
|
|
Tamil Nadu
|
160
|
290
|
240
|
160
|